
AI-Powered LC-OCT Skin Image Analysis for Research
B-scan · Volume · ◉ DEJ overlay – 100% + Reset view
ⓘ Illustrative interface. All names, model names, figures and study data shown are placeholders.
Turn LC-OCT images into research-grade quantitative data with AI-assisted segmentation and analysis.
UNDULIX is analysis software for skin research teams. It traces the dermal–epidermal junction in your LC-OCT scans, measures it, and reports the results the same way every time.


Available for Windows and macOS
UNDULIX LC-OCT Analyzer — For research use only. Not intended for diagnostic or therapeutic use.

PoC with a global top 5 pharmaceutical company through Science Exchange

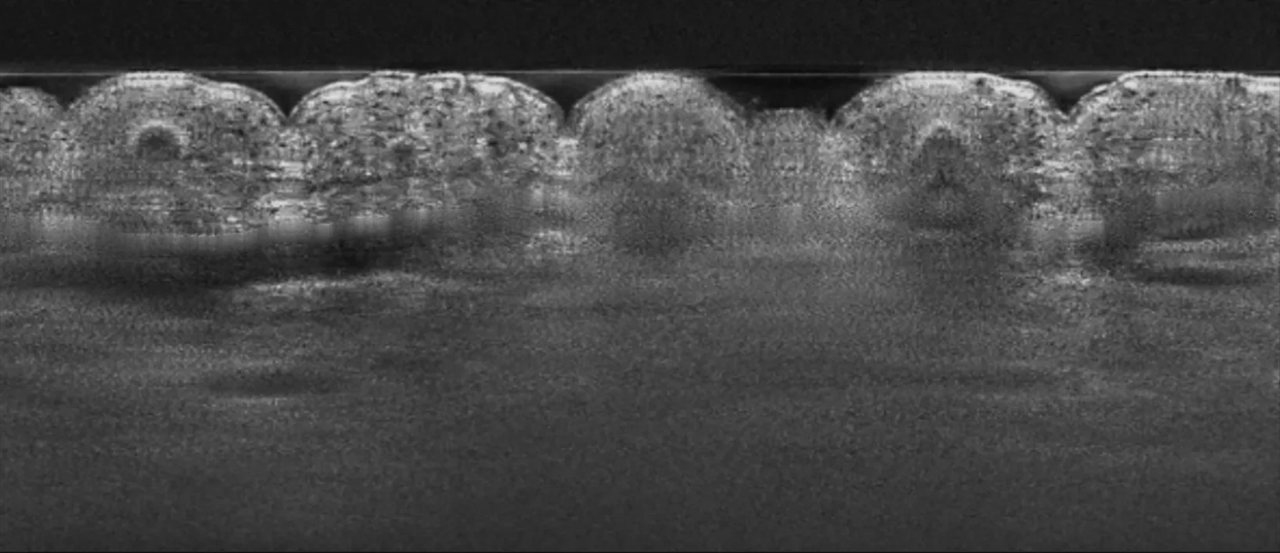
Works with the LC-OCT images your team already acquires

For research use only — not for diagnostic or therapeutic use
How it works
Your lab measures. UNDULIX analyzes. You get the report.
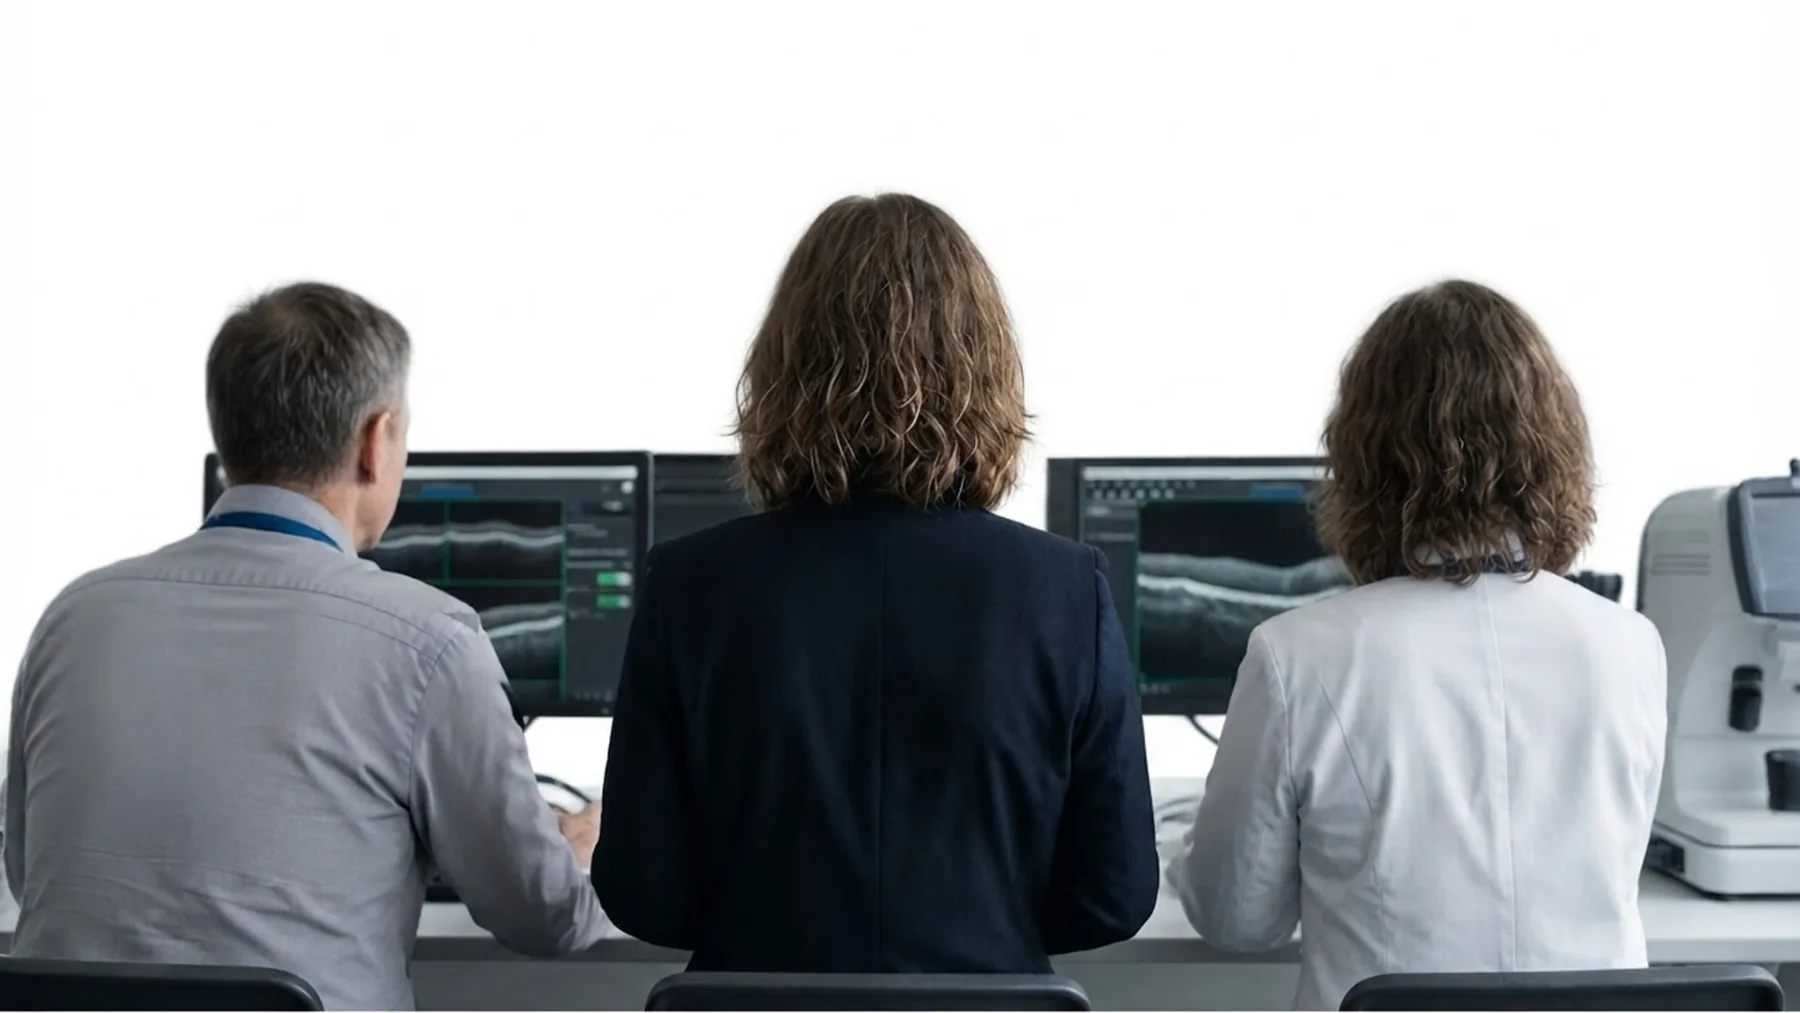
UNDULIX comes in after your imaging. Nothing changes about how your team scans.
1 Your lab measures
Scan with your own LC-OCT device and export a .tif stack.
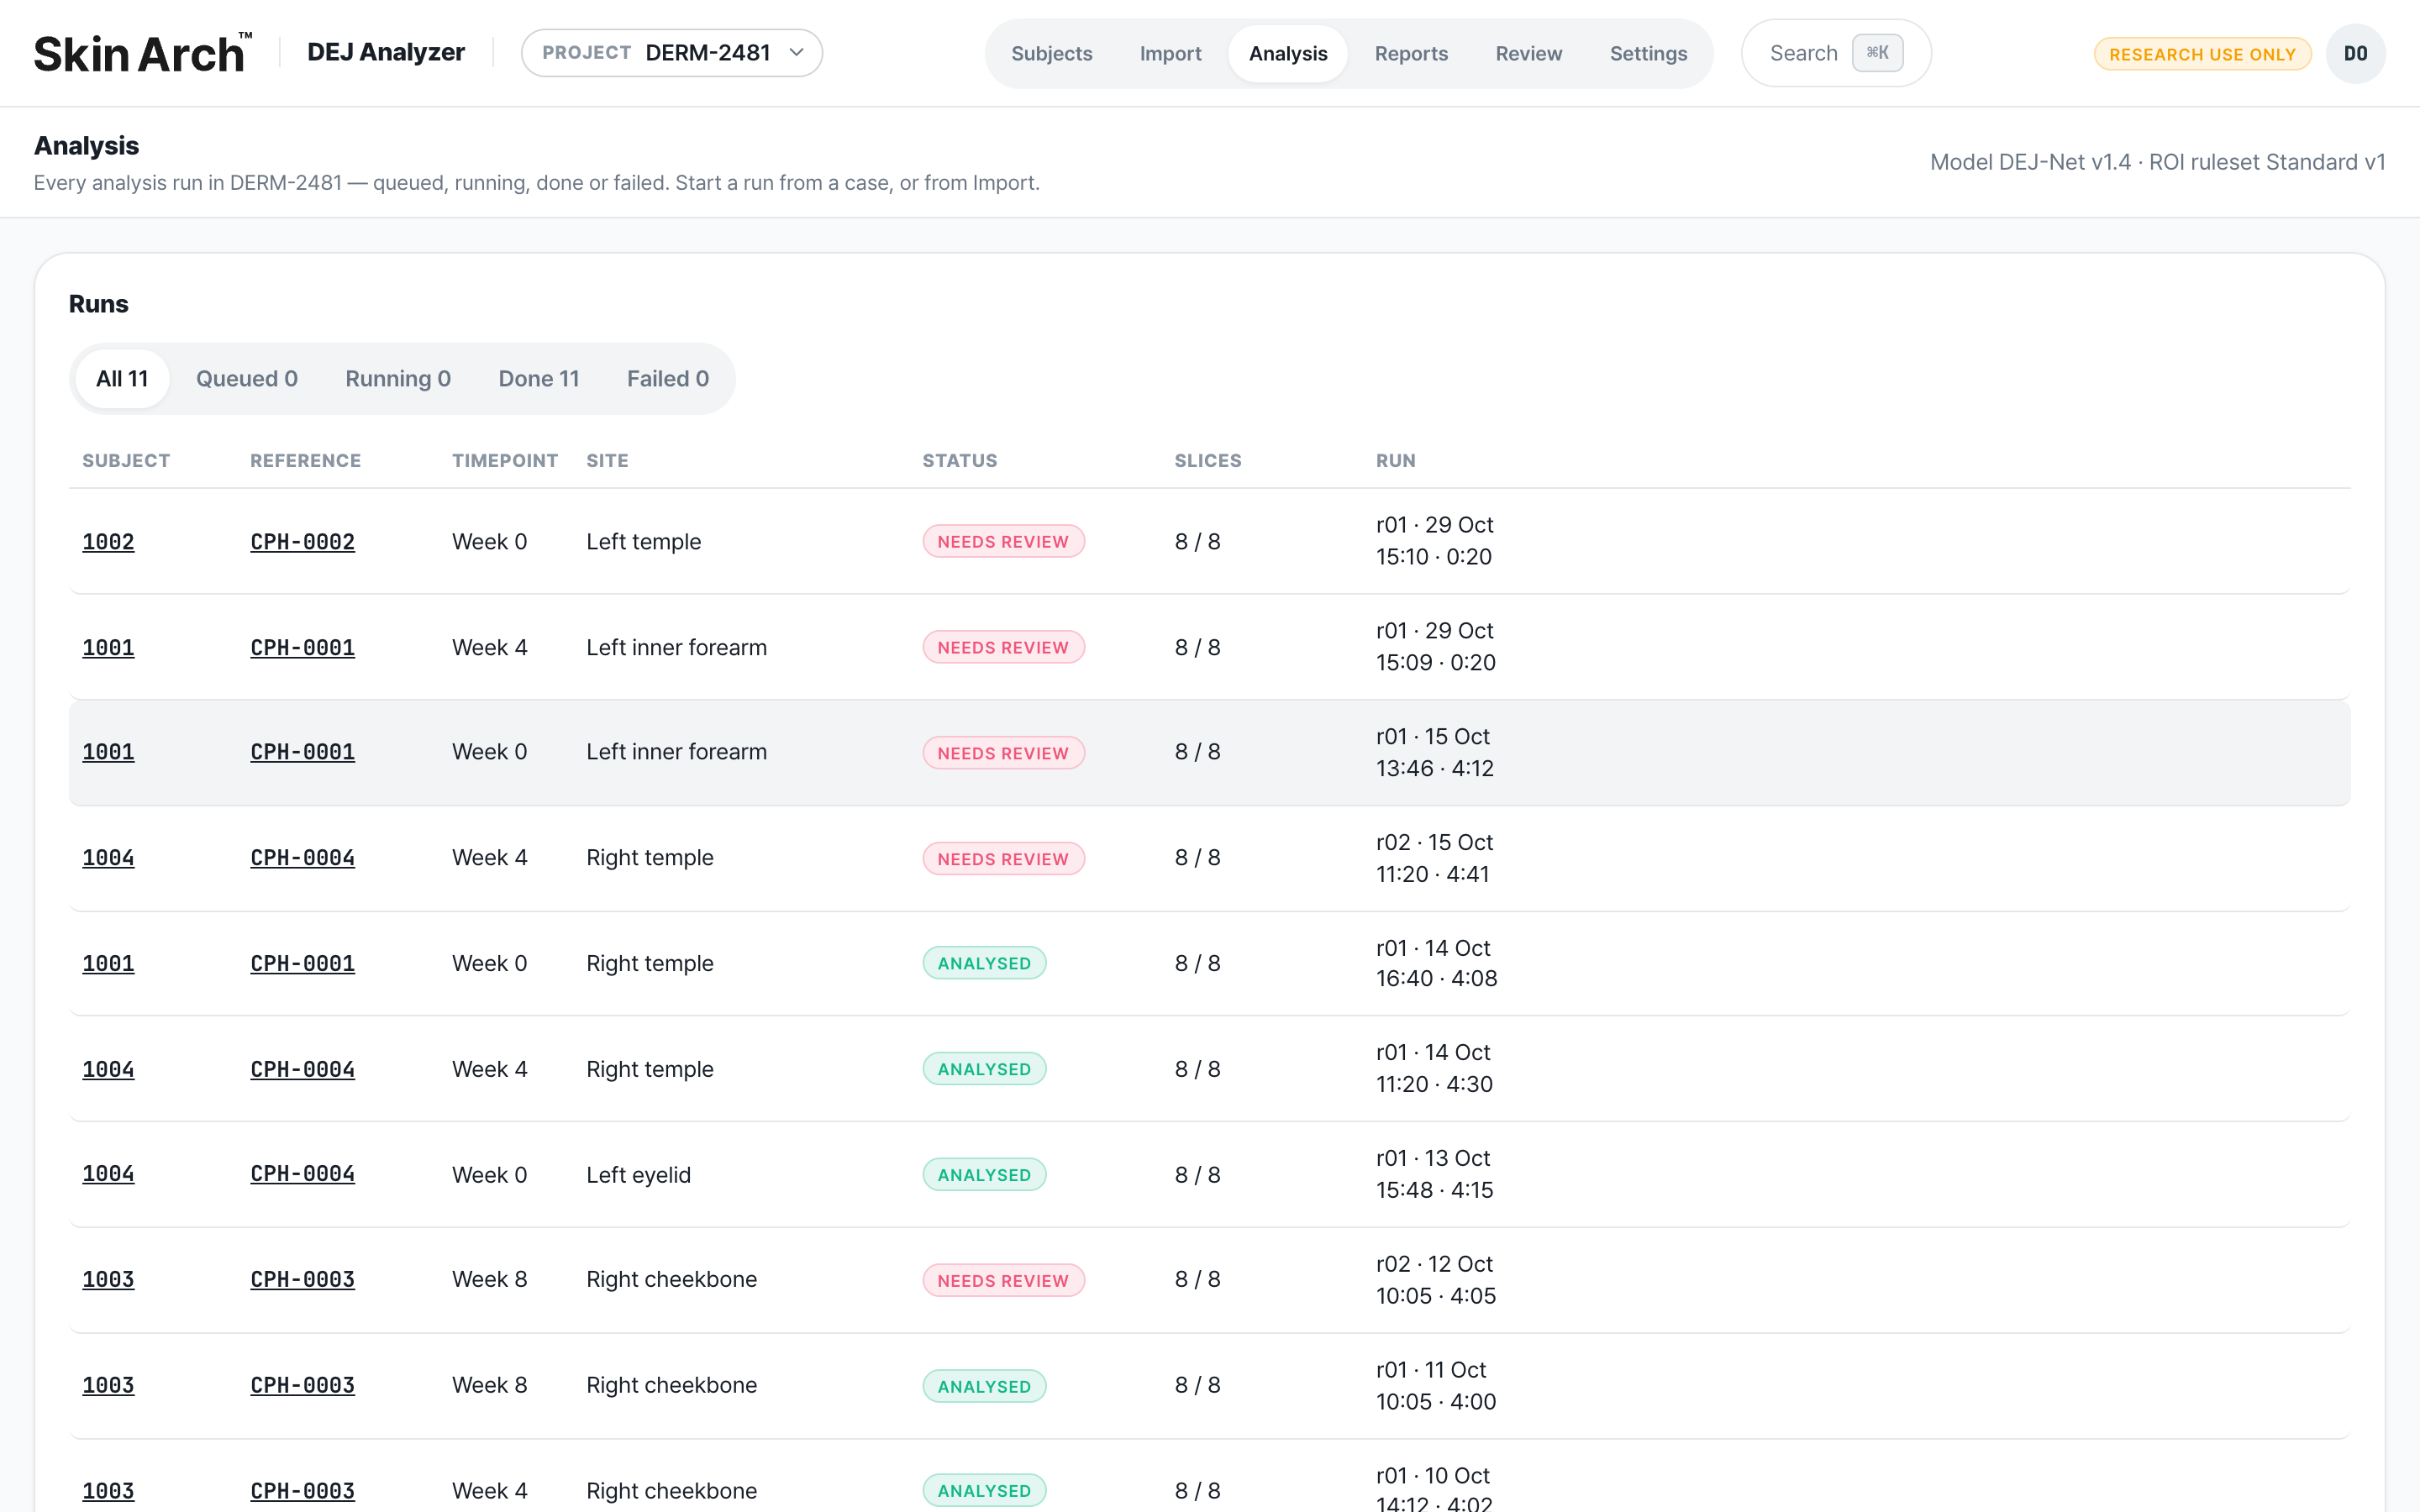
2 UNDULIX analyzes
One click: the AI traces the junction slice by slice.
3 You get the report
Metrics, overlays, a 3D surface and a study report.
What you get
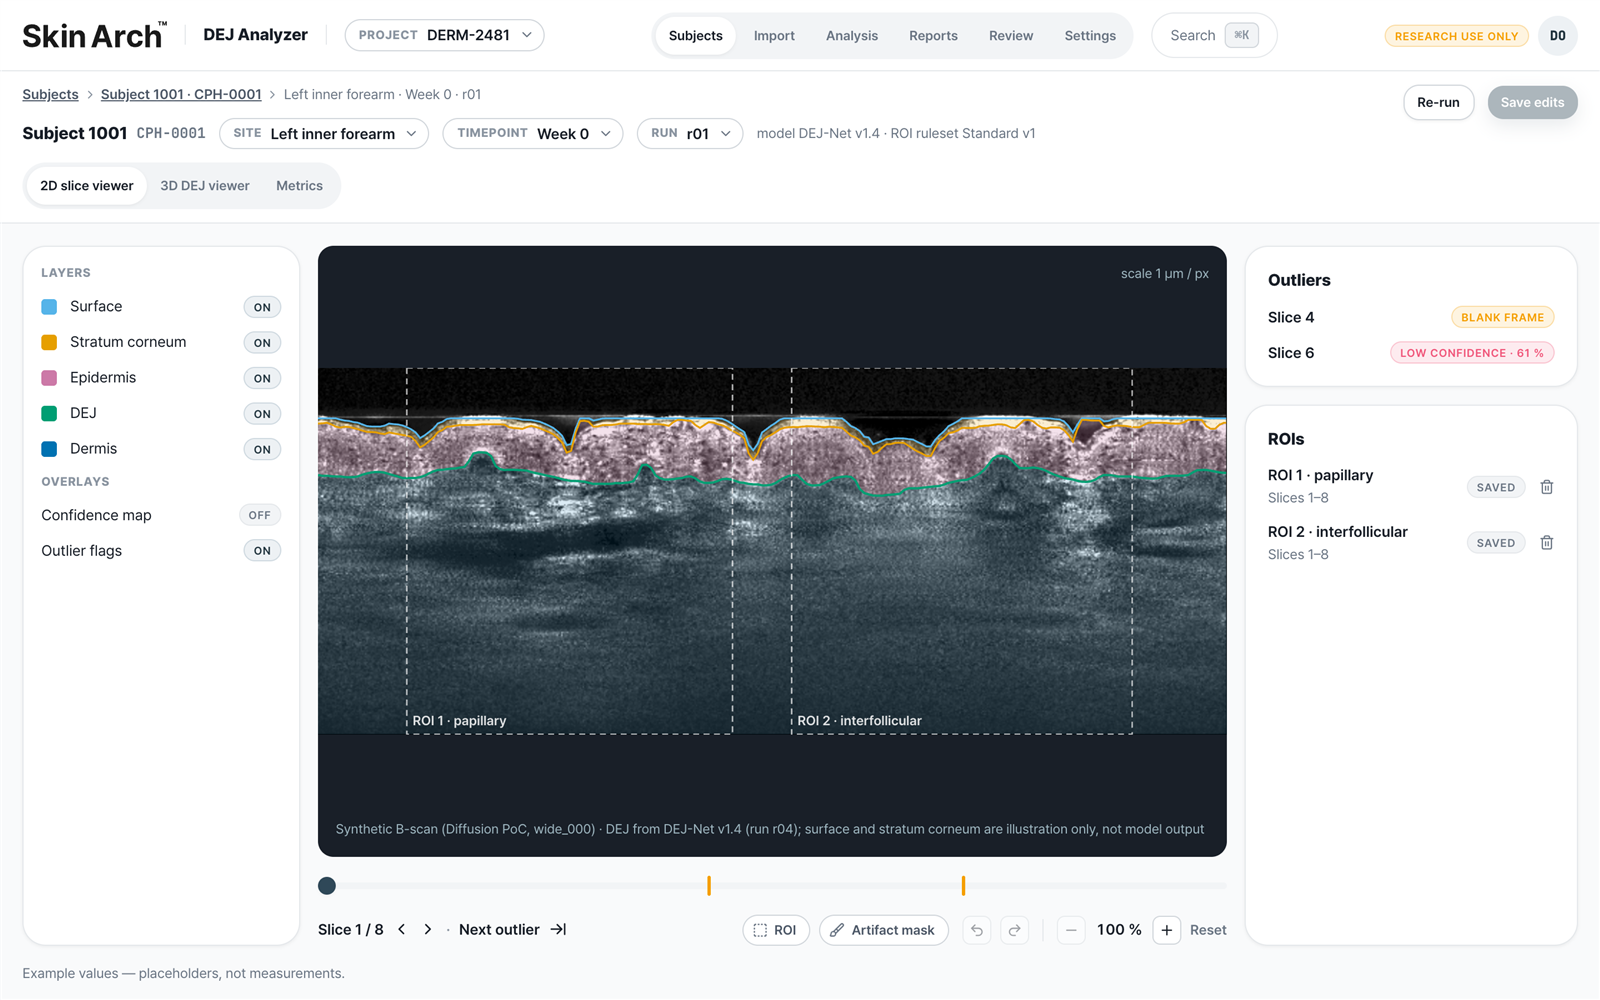
AI-traced DEJ, metrics and a 3D surface
Every slice traced, low-confidence regions marked, and the junction rebuilt as a surface you can turn.
✓ DEJ trace with confidence
✓ DEJ metrics: undulation, roughness Rq/Ra, surface area
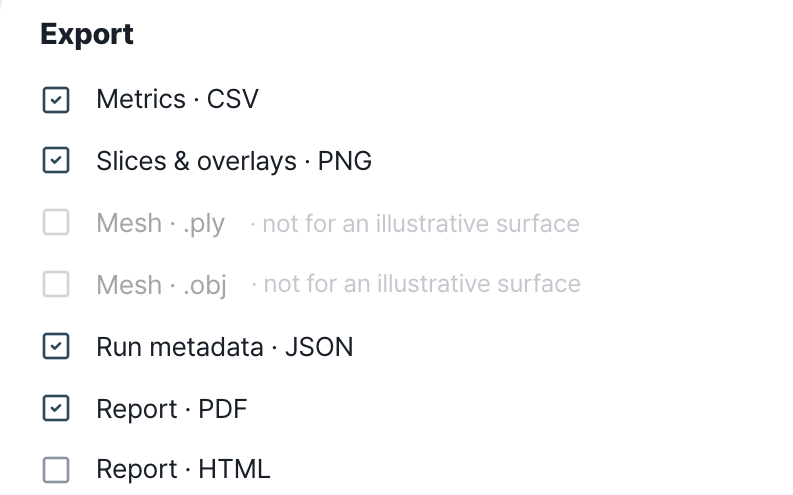
✓ 3D DEJ surface (PLY / OBJ)
✓ Report and data: PDF, HTML, CSV, PNG, JSON
See what you getWork with us
Two ways to work with us
You bring the scans and the research question. We bring UNDULIX and the team behind it.
CES 2027 · Las Vegas
Heading to CES 2027?
Our team will be in Las Vegas in January. Book a time to talk about UNDULIX.

See the Invisible. Measure the Complex.
Start a research partnership
Tell us about your study and whether joint research or a PoC fits better. Our team replies by email.


Available for Windows and macOS
Prefer email? contact@wsoft.space